|
  Find
us on Facebook and Twitter
Find
us on Facebook and Twitter
|
|
Welcome to the CDXZipStream October 2016 Newsletter
In this month's newsletter we highlight the new route
optimization function in CDXZipStream that uses Bing Maps data.
We also review the ways we can provide a custom radius analysis
for a matrix of many locations (customer addresses, store locations,
delivery points, etc.) using our Geographic Access template as a
starting point.
Here's the latest blog posting on the website:
- Route Optimization in Excel Using Bing Maps
|
|
Route
Optimization Using Bing Maps Data
As announced in our last newsletter, the latest
version of CDXZipStream now offers route optimization and expanded
mapping capability, using data from Bing Maps. Here is a short
tutorial that walks through the process of route optimization while
using the function CDXRouteBing:
|
|
|
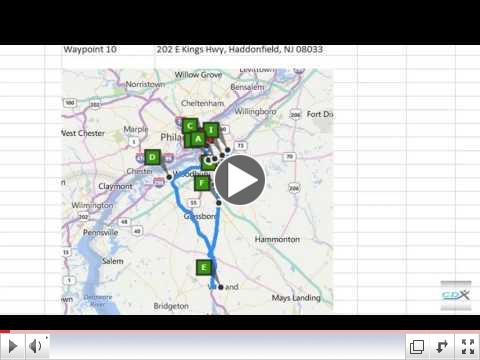
Route Optimization Using Bing Maps in Excel
|
To activate route optimization, go to the "Bing
Maps Settings" area, accessible from either the
"Settings" icon on the CDXZipStream commandbar or the
CDXRouteBing dialog box. Check the "Optimize Routes"
box and the function will automatically optimize a list of up to 25
locations. Calculation time is very fast. CDXZipStream
calculates driving distance and driving time, finds the optimized
waypoint list, maps, and obtains driving directions for the complete
route.
When using Bing Maps you have the option to select a
fixed or non-fixed end point for the optimized route. With a
fixed end point, the optimized route will both begin and end with the
same locations as the original input list. With a non-fixed end
point only the beginning of the route is fixed, and optimization will
select an end point that facilitates return to the beginning
location.
Route optimization can be performed using the
CDXRouteBing worksheet function, and or you can download
and use a free Microsoft Excel template which completely automates
the process. Just copy and paste your list of locations, choose
the desired settings, and click a button to obtain a full trip report
for the optimized route. There are actually two templates
available that perform route optimization, that use as input either
text addresses (such as 123 Main Street, Springfield, IL 55555) or
points of latitude and longitude.
Route optimization using Bing Maps data, as well as
the expanded mapping capability, are both available in the
CDXZipStream Bing and higher versions. If you currently own the
64-bit version of CDXZipStream and would like to upgrade to take
advantage of the new functionality, login to CDXTech.com and in the
account area, under CDXZipStream, select "Upgrade Licenses"
to start the purchasing process. If you own the older 32-bit
CDXZipStream, you can upgrade free to the 64-bit version by
purchasing a maintenance subscription.
|
|
Customize Your Geographic Access Analysis
Did you know we offer customization services for our
Geographic Access Analysis template?
The template, working with CDXZipStream, can take a
matrix of X and Y locations (such as retail stores, customer locations,
warehouses, or points of delivery) and create a complete radius report
showing which X locations are within a specified radius distance of all
Y locations, or vice versa. It is commonly used as a store
locator tool, to identify the stores located within a radius distance
of a customer list, but has wide application to many location-based
analyses. Here is a short tutorial showing how it works:
|
|
|
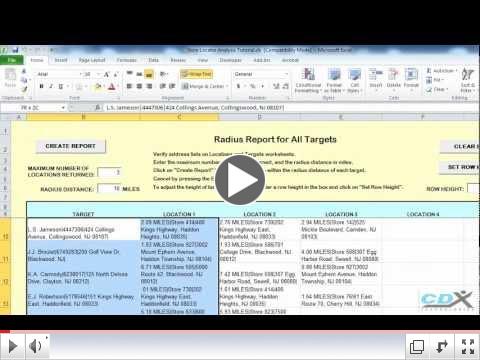
Geographic
Access Analysis in Microsoft Excel
|
(Note that since this video was posted, we have added
Bing Maps functionality to the template to provide validation and
geocoding of all address data.)
Here are some of the ways the template can be customized
to fit the exact needs of your organization:
Calculate access performance
- Once the radius report is generated it can be used to calculate
performance any number of ways. What percentage of customers live
within x miles of at least two stores? Which stores within y miles
cover the most customers? How many customers must travel at least y
miles to a store? These and other measurements can be extremely useful
in areas ranging from resource allocation to developing a long-term
business strategy.
Add demographic or other location-based data -
Get demographic data for each location and/or target using one of
CDXZipStream's demographic feeds, and include that data as part of the
radius report. For example, access requirements for health care
facilities can be dependent on population density. With a radius report
showing the closest facilities to each prospective patient, population
density for each patient ZIP Code (based on population and land area
data obtained from the CDXZipCode Feed) can be used to classify each
patient as living in an urban, suburban, or rural area.
Add more criteria to the radius report - The radius report shows
locations closest to each target, within a radius distance you specify,
but additional criteria can be used as well. Need to find distribution
centers within a radius distance of retail stores, but only those
within the same state? State location can easily be added as a
secondary criterion in the report. These additional criteria don't have
to be based on location; any descriptive data that can be included in
the location listing (number of employees, services provided, etc.) can
be used in the radius report.
Create custom reports based on the radius report - The results
of the radius report can be used to produce more detailed reports for
each location, or groups of locations. For example, with a radius
report showing stores within a radius distance of each customer,
additional reports can be built showing customers (within the radius
distance) associated with each store. Similar reports can also be
generated across stores groupings, showing customers associated with
full service stores, stores within a single state, etc.
Add billing and other numerical data - Any numerical data
associated with targets or locations, such as billing and cost data,
can be included as part of the radius report or other custom reports
described above. These values can then be summed or averaged, for
example, for a group of targets and/or locations. Numerical-based
reports such as these can often replace time-consuming manual processes
as well as provide hard numbers for facility planning purposes.
The template is compatible with the CDXZipStream Bing
version and higher, and is available for purchase from your account
area under the "Buy Data Update" menu. The basic
template costs $149.95, and additional customization fees are billed at
$80 per hour. You can call us at 1-877-CDX-TEC1 (239-8321) or
email customsolutions@cdxtech.com
for a free estimate.
|
Latest Data
Updates
Canadian and
U.S. data feeds of CDXZipStream were updated as of October 26.
There were 144 changes made to the U.S. database this month.
If you would like to update your database to reflect these
changes, select the "Account" option on the CDXZipStream
commandbar and click on "Check for Available Database
Updates". You can then update each database as
required.
CDXZipStream
updates are a part of the one-year software maintenance
subscription included with your purchase. If you would like to
extend your subscription, please sign in to the CDX Technologies
website and from the account area for CDXZipStream, select "Buy
Data Update".
As always
we hope you find the information here helpful for you and your
organization. You can contact us with your feedback and
suggestions by replying to this email.
The Team at CDX
Technologies
|
|
|
|
|
In
This Issue
Route
Optimization Using Bing Maps Data
Customize
Your Geographic Access Analysis
Data
Updates
|
|